| highlighted cell(s) above show current scope |
|---|
| links point to other scopes |
|---|
| Load |
Count
(xact/sec) |
Volume
(Mbits/sec) |
|---|
| offered |
32.37 |
1.83 |
|---|
| measured |
32.36 |
1.80 |
|---|
| Load trace |
|---|
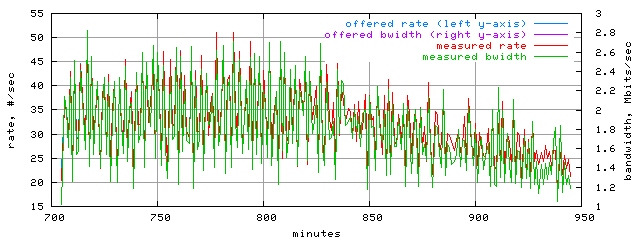 |
The load table shows offered and measured load from client side point of view. Offered load statistics are based on the request stream. Measured load statistics are based on reply messages. The 'count' column depicts the number of requests or responses.
The 'volume' column is a little bit more tricky to interpret. Offered volume is reply bandwidth that would have been required to support offered load. This volume is computed as request rate multiplied by measured mean response size. Measured volume is the actual or measured reply bandwidth.
| Hit Ratios |
DHR
(%) |
BHR
(%) |
|---|
| offered |
59.43 |
41.82 |
|---|
| measured |
48.75 |
32.84 |
|---|
The hit ratios table shows offered and measured hit ratios from client side point of view. Polygraph counts every repeated request to a cachable object as an offered hit. Measured (cache) hits are detected using Polygraph-specific headers. All hits are counted for 'basic' transactions only (simple HTTP GET requests with '200 OK' responses).
DHR, Document Hit Ratio, is the ratio of the total number of hits to the number of all basic transactions (hits and misses). BHR, Byte Hit Ratio, is the ratio of the total volume (a sum of response sizes) of hits to the total volume of all basic transactions.
A better way to measure hit ratio is to compare client- and server-side traffic. A hit ratio table based on such a comparison is available elsewhere.
| Transaction state |
Number of times |
Mean concurrency level |
|---|
| entered |
left |
|---|
| active |
466127.00 |
466049.00 |
496.57 |
|---|
| waiting |
714187.00 |
464102.00 |
21406.97 |
|---|
| concurrent HTTP transaction level trace |
|---|
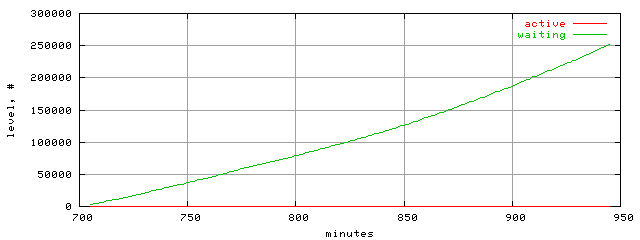 |
TBD.
| Connection state |
Number of times |
Mean concurrency level |
|---|
| entered |
left |
|---|
| open |
40889.00 |
40814.00 |
496.63 |
|---|
| established |
37072.00 |
37031.00 |
428.87 |
|---|
| concurrent HTTP/TCP connection level trace |
|---|
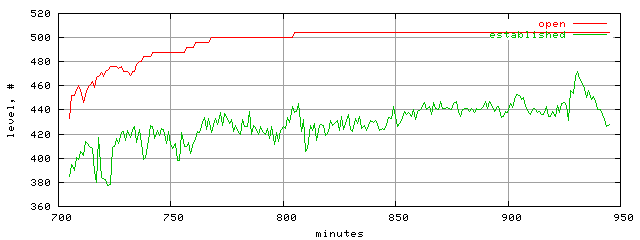 |
TBD.
| Number of agents |
Mean population level |
|---|
| created |
destroyed |
|---|
| 0.00 |
0.00 |
126.00 |
| population level trace |
|---|
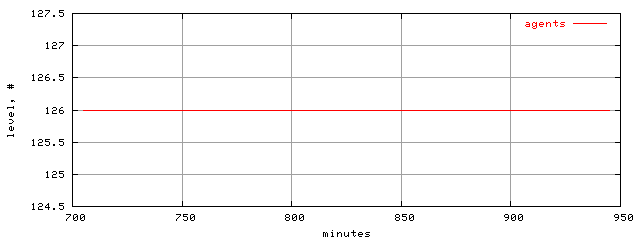 |
Populus is a set of all live robot or server agents. While alive, an agent may participate in HTTP transactions or remain idle.
| Stream |
Contribution |
Rates |
Totals |
|---|
Count
(%) |
Volume
(%) |
Count
(xact/sec) |
Volume
(Mbits/sec) |
Count
(xact,M) |
Volume
(Gbyte) |
|---|
| "foreign" |
0.00 |
0.00 |
0.00 |
0.00 |
0.00 |
0.00 |
|---|
| "image" |
58.43 |
39.20 |
18.53 |
0.70 |
0.27 |
1.24 |
|---|
| "HTML" |
17.98 |
12.39 |
5.70 |
0.22 |
0.08 |
0.39 |
|---|
| "download" |
0.25 |
7.69 |
0.08 |
0.14 |
0.00 |
0.24 |
|---|
| "applet" |
0.43 |
0.23 |
0.14 |
0.00 |
0.00 |
0.01 |
|---|
| "other" |
8.37 |
28.39 |
2.65 |
0.51 |
0.04 |
0.90 |
|---|
| all content types |
85.46 |
87.90 |
27.10 |
1.58 |
0.39 |
2.78 |
|---|
| hits |
41.66 |
28.87 |
13.21 |
0.52 |
0.19 |
0.91 |
|---|
| misses |
43.80 |
59.04 |
13.89 |
1.06 |
0.20 |
1.87 |
|---|
| hits and misses |
85.46 |
87.90 |
27.10 |
1.58 |
0.39 |
2.78 |
|---|
| ims/200 |
5.35 |
5.76 |
1.70 |
0.10 |
0.02 |
0.18 |
|---|
| ims/304 |
3.41 |
0.06 |
1.08 |
0.00 |
0.02 |
0.00 |
|---|
| all ims |
8.76 |
5.83 |
2.78 |
0.10 |
0.04 |
0.18 |
|---|
| cachable |
69.17 |
65.92 |
21.93 |
1.18 |
0.32 |
2.08 |
|---|
| not cachable |
16.30 |
21.98 |
5.17 |
0.40 |
0.07 |
0.69 |
|---|
| cachable and not |
85.46 |
87.90 |
27.10 |
1.58 |
0.39 |
2.78 |
|---|
| fill |
27.51 |
37.06 |
8.72 |
0.67 |
0.13 |
1.17 |
|---|
| reload |
5.34 |
5.54 |
1.69 |
0.10 |
0.02 |
0.17 |
|---|
| abort |
0.05 |
0.03 |
0.02 |
0.00 |
0.00 |
0.00 |
|---|
| redirected request |
0.00 |
0.00 |
0.00 |
0.00 |
0.00 |
0.00 |
|---|
| reply to redirect |
0.00 |
0.00 |
0.00 |
0.00 |
0.00 |
0.00 |
|---|
| HEAD |
0.02 |
0.00 |
0.01 |
0.00 |
0.00 |
0.00 |
|---|
| POST |
0.41 |
0.73 |
0.13 |
0.01 |
0.00 |
0.02 |
|---|
| PUT |
0.00 |
0.00 |
0.00 |
0.00 |
0.00 |
0.00 |
|---|
| all non-gets |
0.44 |
0.74 |
0.14 |
0.01 |
0.00 |
0.02 |
|---|
| all replies |
100.00 |
100.00 |
31.71 |
1.80 |
0.46 |
3.16 |
|---|
The 'Stream' table provides count and volume statistics for many classes of transactions. The 'Contribution' columns show count- and volume-based portions of all transactions. The 'Rates' columns show throughput and bandwidth measurements. The 'Totals' columns contain the total number of transactions and the total volume (a sum of individual response sizes) for each stream.
Note that some streams are a combination of other streams. For example, the 'all ims' stream contains transactions with If-Modified-Since requests that resulted in either '200 OK' (the 'ims/304' stream) or '304 Not Modified' (the 'ims/304' stream) responses.
Many combination streams, such as 'all content types' or 'hits and misses' stream, contribute less than 100% because properties like content type or hit status are distinguished for 'basic' transactions only. A basic transactions is a simple HTTP GET request resulted in a '200 OK' response. Various special transactions such as IMS or aborts do not belong to the 'basic' category.
The 'Object' table contains corresponding response time and size statistics for streams.
| Object |
Response time (msec) |
Size (KBytes) |
|---|
| Min |
Mean |
Max |
Min |
Mean |
Max |
|---|
| "foreign" |
n/a |
n/a |
n/a |
n/a |
n/a |
n/a |
|---|
| "image" |
n/a |
n/a |
n/a |
0.32 |
4.87 |
53.66 |
|---|
| "HTML" |
n/a |
n/a |
n/a |
0.38 |
5.00 |
63.92 |
|---|
| "download" |
n/a |
n/a |
n/a |
18.34 |
220.69 |
1304.21 |
|---|
| "applet" |
n/a |
n/a |
n/a |
0.80 |
3.88 |
21.59 |
|---|
| "other" |
n/a |
n/a |
n/a |
7.74 |
24.61 |
72.70 |
|---|
| all content types |
n/a |
n/a |
n/a |
0.32 |
7.46 |
1304.21 |
|---|
| hits |
4.00 |
14110.70 |
1155857.00 |
0.41 |
5.03 |
509.61 |
|---|
| misses |
9.00 |
11515.69 |
640986.00 |
0.32 |
9.78 |
1304.21 |
|---|
| hits and misses |
4.00 |
12780.64 |
1155857.00 |
0.32 |
7.46 |
1304.21 |
|---|
| ims/200 |
4.00 |
12561.47 |
537615.00 |
0.32 |
7.82 |
1304.16 |
|---|
| ims/304 |
0.00 |
13259.21 |
566754.00 |
0.00 |
0.14 |
0.16 |
|---|
| all ims |
0.00 |
12833.22 |
566754.00 |
0.00 |
4.83 |
1304.16 |
|---|
| cachable |
4.00 |
13326.52 |
1155857.00 |
0.38 |
6.91 |
1304.21 |
|---|
| not cachable |
9.00 |
10463.68 |
581744.00 |
0.32 |
9.78 |
113.14 |
|---|
| cachable and not |
4.00 |
12780.64 |
1155857.00 |
0.32 |
7.46 |
1304.21 |
|---|
| fill |
9.00 |
12138.92 |
640986.00 |
0.38 |
9.77 |
1304.21 |
|---|
| reload |
10.00 |
7174.42 |
331149.00 |
0.32 |
7.52 |
1304.16 |
|---|
| abort |
5024.00 |
14837.41 |
303558.00 |
0.33 |
5.15 |
34.78 |
|---|
| redirected request |
n/a |
n/a |
n/a |
n/a |
n/a |
n/a |
|---|
| reply to redirect |
n/a |
n/a |
n/a |
n/a |
n/a |
n/a |
|---|
| HEAD |
164.00 |
15144.96 |
310056.00 |
0.32 |
0.38 |
0.46 |
|---|
| POST |
12.00 |
9551.13 |
179686.00 |
0.38 |
12.92 |
467.69 |
|---|
| PUT |
n/a |
n/a |
n/a |
n/a |
n/a |
n/a |
|---|
| all non-gets |
12.00 |
9870.61 |
310056.00 |
0.32 |
12.21 |
467.69 |
|---|
| all replies |
0.00 |
12473.04 |
1155857.00 |
0.00 |
7.25 |
1304.21 |
|---|
The 'Object' table provides response time and response size statistics for many classes of transactions.
Note that some classes are a combination of other classes. For example, the 'all ims' class contains transactions with If-Modified-Since requests that resulted in either '200 OK' (the 'ims/304' class) or '304 Not Modified' (the 'ims/304' class) responses.
Some statistics may not be available because either no objects of the corresponding class were seen during the test or no facilities to collect the stats exist for the class. The former can be verified using a 'Stream' table.
The total of 7462 errors detected. Out of those errors, 7460xact or 1.61% of all transactions were classified as transaction errors.
| Error |
Count |
Contribution (%) |
|---|
| (s110) Connection timed out |
4189 |
56.14 |
|---|
| (s104) Connection reset by peer |
2154 |
28.87 |
|---|
| (c17) connection closed before sending headers |
1117 |
14.97 |
|---|
| (c54) internal timers may be getting behind |
2 |
0.03 |
|---|
The 'Errors' table shows detected errors. For each
error type, the number of errors and their contribution towards
total error count are shown.
No instances of this object class were observed or recorded in the given scope.
This object class represents one of the content types specified in the PGL workload file and labeled there as "foreign".
| contribution: |
58.43% by count and 39.20% by volume |
|---|
| rates: |
18.53xact/sec or 0.70Mbits/sec |
|---|
| totals: |
0.27Mxact and 1.24GByte |
|---|
| response time: |
n/a min, n/a mean, and n/a max |
|---|
| response size: |
0.32KBytes min, 4.87KBytes mean, and 53.66KBytes max |
|---|
No response time and size histograms were collected or stored for this object class.
No response time and size traces are collected for this object class.
This object class represents one of the content types specified in the PGL workload file and labeled there as "image".
| contribution: |
17.98% by count and 12.39% by volume |
|---|
| rates: |
5.70xact/sec or 0.22Mbits/sec |
|---|
| totals: |
0.08Mxact and 0.39GByte |
|---|
| response time: |
n/a min, n/a mean, and n/a max |
|---|
| response size: |
0.38KBytes min, 5.00KBytes mean, and 63.92KBytes max |
|---|
No response time and size histograms were collected or stored for this object class.
No response time and size traces are collected for this object class.
This object class represents one of the content types specified in the PGL workload file and labeled there as "HTML".
| contribution: |
0.25% by count and 7.69% by volume |
|---|
| rates: |
0.08xact/sec or 0.14Mbits/sec |
|---|
| totals: |
0.00Mxact and 0.24GByte |
|---|
| response time: |
n/a min, n/a mean, and n/a max |
|---|
| response size: |
18.34KBytes min, 220.69KBytes mean, and 1304.21KBytes max |
|---|
No response time and size histograms were collected or stored for this object class.
No response time and size traces are collected for this object class.
This object class represents one of the content types specified in the PGL workload file and labeled there as "download".
| contribution: |
0.43% by count and 0.23% by volume |
|---|
| rates: |
0.14xact/sec or 0.00Mbits/sec |
|---|
| totals: |
0.00Mxact and 0.01GByte |
|---|
| response time: |
n/a min, n/a mean, and n/a max |
|---|
| response size: |
0.80KBytes min, 3.88KBytes mean, and 21.59KBytes max |
|---|
No response time and size histograms were collected or stored for this object class.
No response time and size traces are collected for this object class.
This object class represents one of the content types specified in the PGL workload file and labeled there as "applet".
| contribution: |
8.37% by count and 28.39% by volume |
|---|
| rates: |
2.65xact/sec or 0.51Mbits/sec |
|---|
| totals: |
0.04Mxact and 0.90GByte |
|---|
| response time: |
n/a min, n/a mean, and n/a max |
|---|
| response size: |
7.74KBytes min, 24.61KBytes mean, and 72.70KBytes max |
|---|
No response time and size histograms were collected or stored for this object class.
No response time and size traces are collected for this object class.
This object class represents one of the content types specified in the PGL workload file and labeled there as "other".
| contribution: |
85.46% by count and 87.90% by volume |
|---|
| rates: |
27.10xact/sec or 1.58Mbits/sec |
|---|
| totals: |
0.39Mxact and 2.78GByte |
|---|
| response time: |
n/a min, n/a mean, and n/a max |
|---|
| response size: |
0.32KBytes min, 7.46KBytes mean, and 1304.21KBytes max |
|---|
No response time and size histograms were collected or stored for this object class.
No response time and size traces are collected for this object class.
No description is available for this object class.
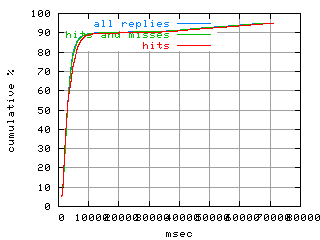
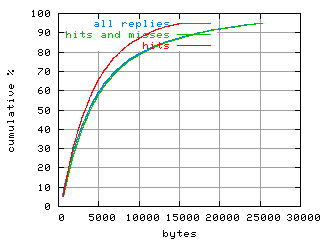
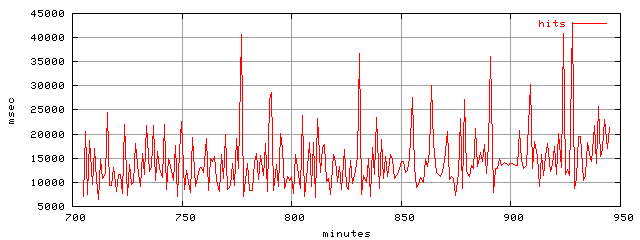
This object class belongs to the 'all replies' class.
| contribution: |
41.66% by count and 28.87% by volume |
|---|
| rates: |
13.21xact/sec or 0.52Mbits/sec |
|---|
| totals: |
0.19Mxact and 0.91GByte |
|---|
| response time: |
4.00msec min, 14110.70msec mean, and 1155857.00msec max |
|---|
| response size: |
0.41KBytes min, 5.03KBytes mean, and 509.61KBytes max |
|---|
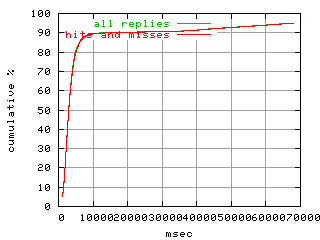
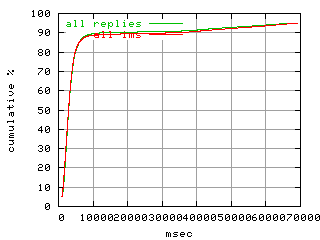
| response time distribution |
|---|
 |
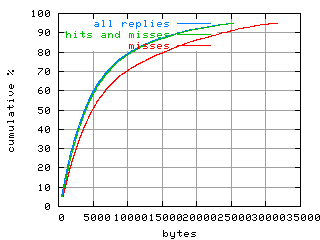
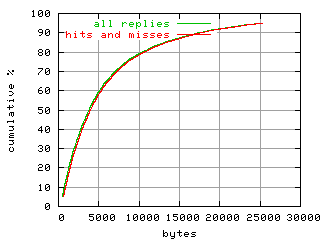
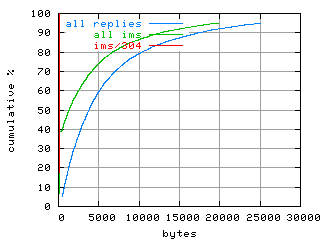
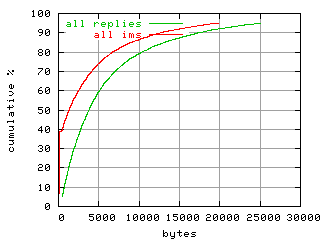
| object size distribution |
|---|
 |
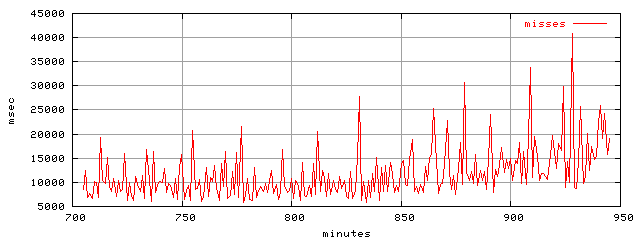
| response time trace |
|---|
 |
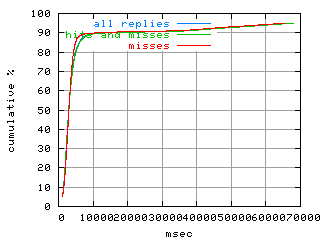
No description is available for this object class.
This object class belongs to the 'hits and misses' class.
| contribution: |
43.80% by count and 59.04% by volume |
|---|
| rates: |
13.89xact/sec or 1.06Mbits/sec |
|---|
| totals: |
0.20Mxact and 1.87GByte |
|---|
| response time: |
9.00msec min, 11515.69msec mean, and 640986.00msec max |
|---|
| response size: |
0.32KBytes min, 9.78KBytes mean, and 1304.21KBytes max |
|---|
| response time distribution |
|---|
 |
| object size distribution |
|---|
 |
| response time trace |
|---|
 |
No description is available for this object class.
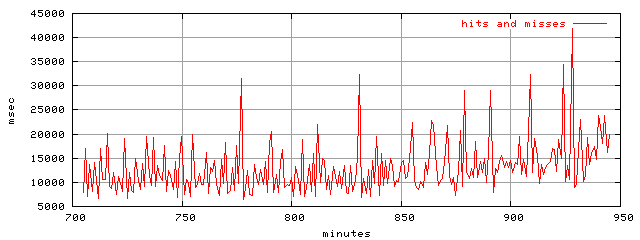
This object class belongs to the 'hits and misses' class.
| contribution: |
85.46% by count and 87.90% by volume |
|---|
| rates: |
27.10xact/sec or 1.58Mbits/sec |
|---|
| totals: |
0.39Mxact and 2.78GByte |
|---|
| response time: |
4.00msec min, 12780.64msec mean, and 1155857.00msec max |
|---|
| response size: |
0.32KBytes min, 7.46KBytes mean, and 1304.21KBytes max |
|---|
| response time distribution |
|---|
 |
| object size distribution |
|---|
 |
| response time trace |
|---|
 |
No description is available for this object class.
This object class belongs to the 'all replies' class.
| contribution: |
5.35% by count and 5.76% by volume |
|---|
| rates: |
1.70xact/sec or 0.10Mbits/sec |
|---|
| totals: |
0.02Mxact and 0.18GByte |
|---|
| response time: |
4.00msec min, 12561.47msec mean, and 537615.00msec max |
|---|
| response size: |
0.32KBytes min, 7.82KBytes mean, and 1304.16KBytes max |
|---|
| response time distribution |
|---|
 |
| object size distribution |
|---|
 |
No response time and size traces are collected for this object class.
No description is available for this object class.
This object class belongs to the 'all ims' class.
| contribution: |
3.41% by count and 0.06% by volume |
|---|
| rates: |
1.08xact/sec or 0.00Mbits/sec |
|---|
| totals: |
0.02Mxact and 0.00GByte |
|---|
| response time: |
0.00msec min, 13259.21msec mean, and 566754.00msec max |
|---|
| response size: |
0.00KBytes min, 0.14KBytes mean, and 0.16KBytes max |
|---|
| response time distribution |
|---|
 |
| object size distribution |
|---|
 |
No response time and size traces are collected for this object class.
No description is available for this object class.
This object class belongs to the 'all ims' class.
| contribution: |
8.76% by count and 5.83% by volume |
|---|
| rates: |
2.78xact/sec or 0.10Mbits/sec |
|---|
| totals: |
0.04Mxact and 0.18GByte |
|---|
| response time: |
0.00msec min, 12833.22msec mean, and 566754.00msec max |
|---|
| response size: |
0.00KBytes min, 4.83KBytes mean, and 1304.16KBytes max |
|---|
| response time distribution |
|---|
 |
| object size distribution |
|---|
 |
| response time trace |
|---|
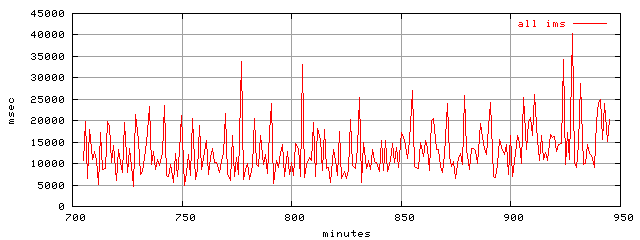 |
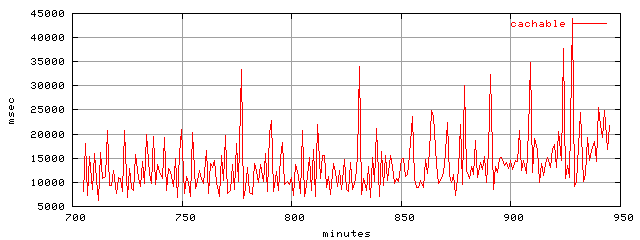
No description is available for this object class.
This object class belongs to the 'all replies' class.
| contribution: |
69.17% by count and 65.92% by volume |
|---|
| rates: |
21.93xact/sec or 1.18Mbits/sec |
|---|
| totals: |
0.32Mxact and 2.08GByte |
|---|
| response time: |
4.00msec min, 13326.52msec mean, and 1155857.00msec max |
|---|
| response size: |
0.38KBytes min, 6.91KBytes mean, and 1304.21KBytes max |
|---|
No response time and size histograms were collected or stored for this object class.
| response time trace |
|---|
 |
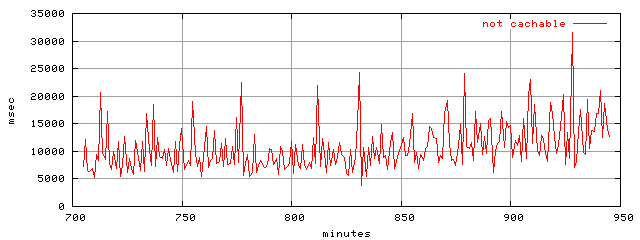
No description is available for this object class.
This object class belongs to the 'cachable and not' class.
| contribution: |
16.30% by count and 21.98% by volume |
|---|
| rates: |
5.17xact/sec or 0.40Mbits/sec |
|---|
| totals: |
0.07Mxact and 0.69GByte |
|---|
| response time: |
9.00msec min, 10463.68msec mean, and 581744.00msec max |
|---|
| response size: |
0.32KBytes min, 9.78KBytes mean, and 113.14KBytes max |
|---|
No response time and size histograms were collected or stored for this object class.
| response time trace |
|---|
 |
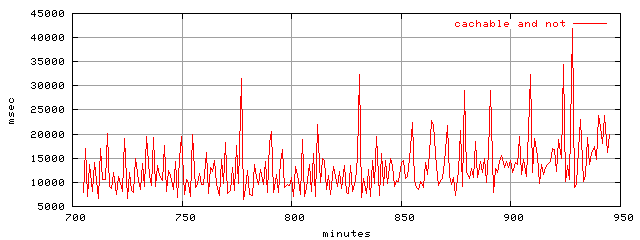
No description is available for this object class.
This object class belongs to the 'cachable and not' class.
| contribution: |
85.46% by count and 87.90% by volume |
|---|
| rates: |
27.10xact/sec or 1.58Mbits/sec |
|---|
| totals: |
0.39Mxact and 2.78GByte |
|---|
| response time: |
4.00msec min, 12780.64msec mean, and 1155857.00msec max |
|---|
| response size: |
0.32KBytes min, 7.46KBytes mean, and 1304.21KBytes max |
|---|
No response time and size histograms were collected or stored for this object class.
| response time trace |
|---|
 |
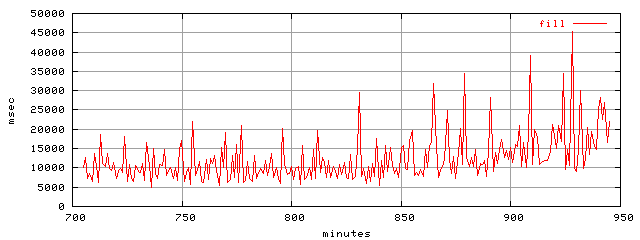
No description is available for this object class.
This object class belongs to the 'all replies' class.
| contribution: |
27.51% by count and 37.06% by volume |
|---|
| rates: |
8.72xact/sec or 0.67Mbits/sec |
|---|
| totals: |
0.13Mxact and 1.17GByte |
|---|
| response time: |
9.00msec min, 12138.92msec mean, and 640986.00msec max |
|---|
| response size: |
0.38KBytes min, 9.77KBytes mean, and 1304.21KBytes max |
|---|
No response time and size histograms were collected or stored for this object class.
| response time trace |
|---|
 |
No description is available for this object class.
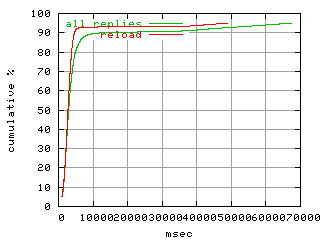
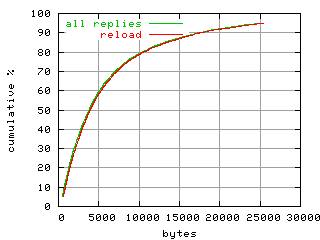
This object class belongs to the 'all replies' class.
| contribution: |
5.34% by count and 5.54% by volume |
|---|
| rates: |
1.69xact/sec or 0.10Mbits/sec |
|---|
| totals: |
0.02Mxact and 0.17GByte |
|---|
| response time: |
10.00msec min, 7174.42msec mean, and 331149.00msec max |
|---|
| response size: |
0.32KBytes min, 7.52KBytes mean, and 1304.16KBytes max |
|---|
| response time distribution |
|---|
 |
| object size distribution |
|---|
 |
| response time trace |
|---|
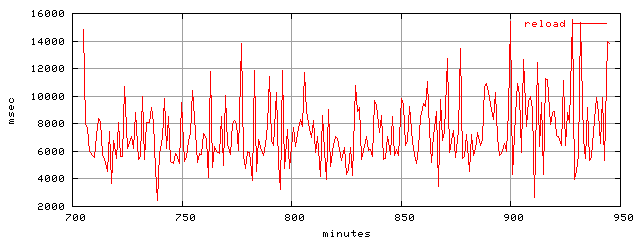 |
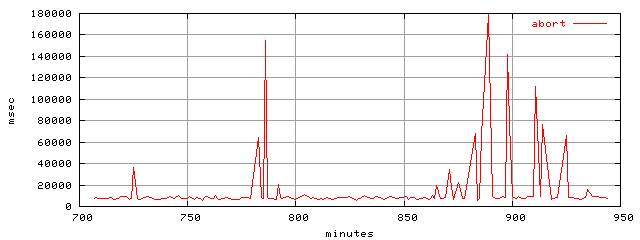
No description is available for this object class.
This object class belongs to the 'all replies' class.
| contribution: |
0.05% by count and 0.03% by volume |
|---|
| rates: |
0.02xact/sec or 0.00Mbits/sec |
|---|
| totals: |
0.00Mxact and 0.00GByte |
|---|
| response time: |
5024.00msec min, 14837.41msec mean, and 303558.00msec max |
|---|
| response size: |
0.33KBytes min, 5.15KBytes mean, and 34.78KBytes max |
|---|
No response time and size histograms were collected or stored for this object class.
| response time trace |
|---|
 |
No description is available for this object class.
This object class belongs to the 'all replies' class.
No instances of this object class were observed or recorded in the given scope.
No description is available for this object class.
This object class belongs to the 'all replies' class.
No instances of this object class were observed or recorded in the given scope.
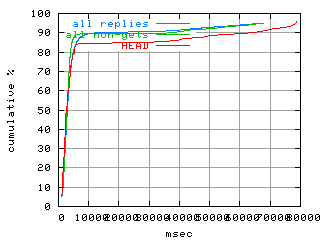
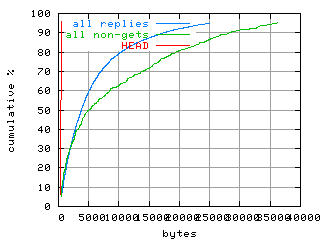
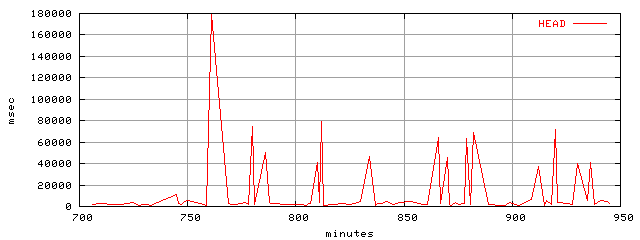
No description is available for this object class.
This object class belongs to the 'all replies' class.
| contribution: |
0.02% by count and 0.00% by volume |
|---|
| rates: |
0.01xact/sec or 0.00Mbits/sec |
|---|
| totals: |
0.00Mxact and 0.00GByte |
|---|
| response time: |
164.00msec min, 15144.96msec mean, and 310056.00msec max |
|---|
| response size: |
0.32KBytes min, 0.38KBytes mean, and 0.46KBytes max |
|---|
| response time distribution |
|---|
 |
| object size distribution |
|---|
 |
| response time trace |
|---|
 |
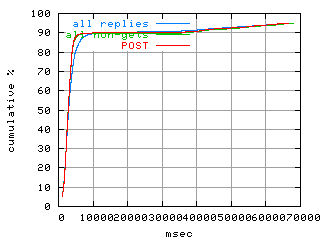
No description is available for this object class.
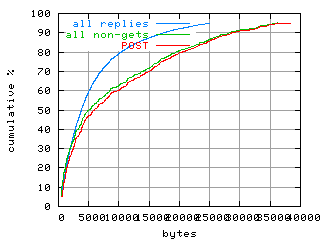
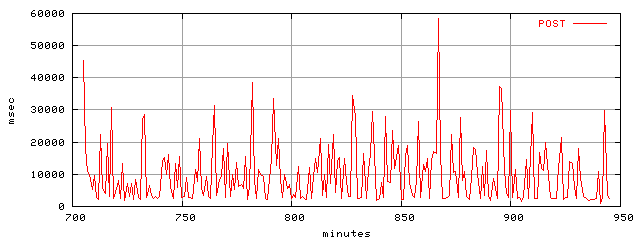
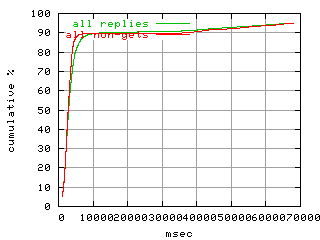
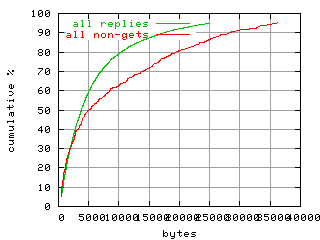
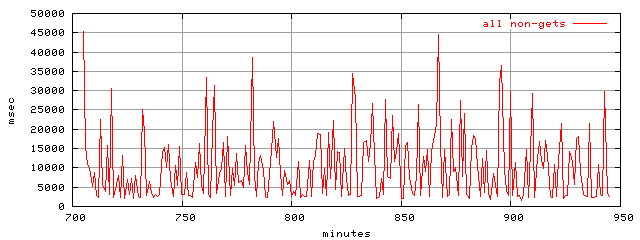
This object class belongs to the 'all non-gets' class.
| contribution: |
0.41% by count and 0.73% by volume |
|---|
| rates: |
0.13xact/sec or 0.01Mbits/sec |
|---|
| totals: |
0.00Mxact and 0.02GByte |
|---|
| response time: |
12.00msec min, 9551.13msec mean, and 179686.00msec max |
|---|
| response size: |
0.38KBytes min, 12.92KBytes mean, and 467.69KBytes max |
|---|
| response time distribution |
|---|
 |
| object size distribution |
|---|
 |
| response time trace |
|---|
 |
No description is available for this object class.
This object class belongs to the 'all non-gets' class.
No instances of this object class were observed or recorded in the given scope.
No description is available for this object class.
This object class belongs to the 'all non-gets' class.
| contribution: |
0.44% by count and 0.74% by volume |
|---|
| rates: |
0.14xact/sec or 0.01Mbits/sec |
|---|
| totals: |
0.00Mxact and 0.02GByte |
|---|
| response time: |
12.00msec min, 9870.61msec mean, and 310056.00msec max |
|---|
| response size: |
0.32KBytes min, 12.21KBytes mean, and 467.69KBytes max |
|---|
| response time distribution |
|---|
 |
| object size distribution |
|---|
 |
| response time trace |
|---|
 |
No description is available for this object class.
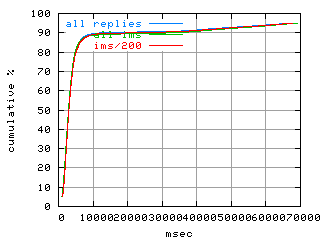
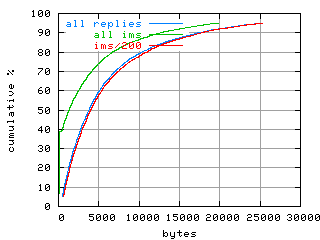
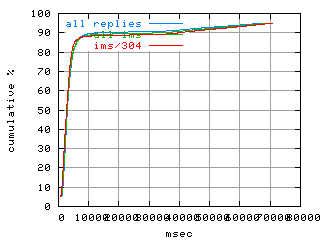
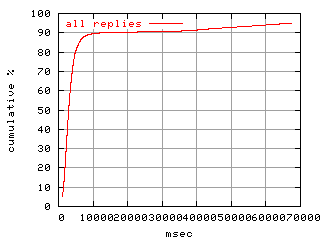
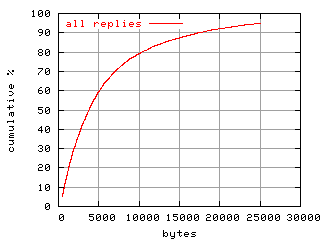
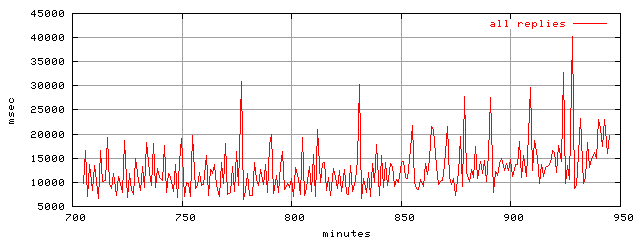
This object class belongs to the 'all replies' class.
| contribution: |
100.00% by count and 100.00% by volume |
|---|
| rates: |
31.71xact/sec or 1.80Mbits/sec |
|---|
| totals: |
0.46Mxact and 3.16GByte |
|---|
| response time: |
0.00msec min, 12473.04msec mean, and 1155857.00msec max |
|---|
| response size: |
0.00KBytes min, 7.25KBytes mean, and 1304.21KBytes max |
|---|
| response time distribution |
|---|
 |
| object size distribution |
|---|
 |
| response time trace |
|---|
 |
No description is available for this object class.