| highlighted cell(s) above show current scope |
|---|
| links point to other scopes |
|---|
| Load |
Count
(xact/sec) |
Volume
(Mbits/sec) |
|---|
| offered |
23.60 |
1.36 |
|---|
| measured |
23.63 |
1.34 |
|---|
| Load trace |
|---|
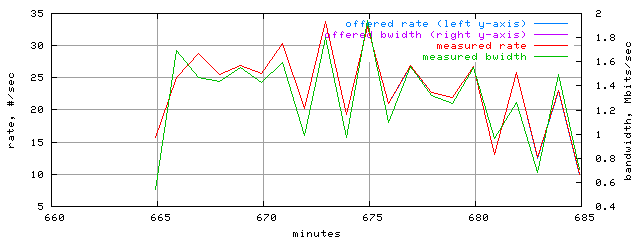 |
The load table shows offered and measured load from client side point of view. Offered load statistics are based on the request stream. Measured load statistics are based on reply messages. The 'count' column depicts the number of requests or responses.
The 'volume' column is a little bit more tricky to interpret. Offered volume is reply bandwidth that would have been required to support offered load. This volume is computed as request rate multiplied by measured mean response size. Measured volume is the actual or measured reply bandwidth.
| Hit Ratios |
DHR
(%) |
BHR
(%) |
|---|
| offered |
59.52 |
41.41 |
|---|
| measured |
62.54 |
41.65 |
|---|
The hit ratios table shows offered and measured hit ratios from client side point of view. Polygraph counts every repeated request to a cachable object as an offered hit. Measured (cache) hits are detected using Polygraph-specific headers. All hits are counted for 'basic' transactions only (simple HTTP GET requests with '200 OK' responses).
DHR, Document Hit Ratio, is the ratio of the total number of hits to the number of all basic transactions (hits and misses). BHR, Byte Hit Ratio, is the ratio of the total volume (a sum of response sizes) of hits to the total volume of all basic transactions.
A better way to measure hit ratio is to compare client- and server-side traffic. A hit ratio table based on such a comparison is available elsewhere.
| Transaction state |
Number of times |
Mean concurrency level |
|---|
| entered |
left |
|---|
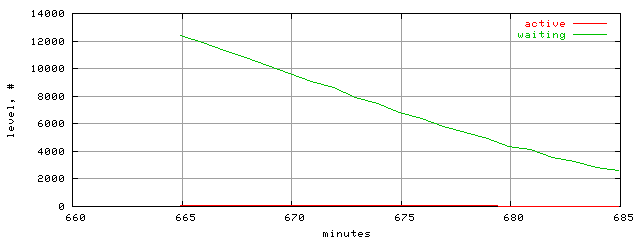
| active |
28358.00 |
28390.00 |
45.02 |
|---|
| waiting |
18243.00 |
28086.00 |
5875.98 |
|---|
| concurrent HTTP transaction level trace |
|---|
 |
TBD.
| Connection state |
Number of times |
Mean concurrency level |
|---|
| entered |
left |
|---|
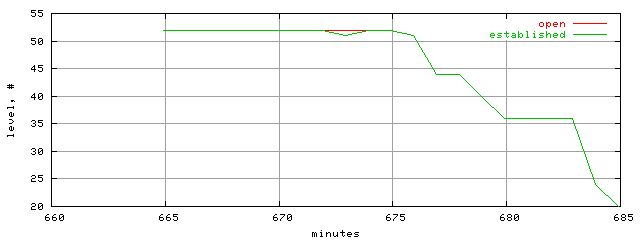
| open |
2419.00 |
2451.00 |
45.18 |
|---|
| established |
2419.00 |
2451.00 |
45.16 |
|---|
| concurrent HTTP/TCP connection level trace |
|---|
 |
TBD.
| Number of agents |
Mean population level |
|---|
| created |
destroyed |
|---|
| 0.00 |
0.00 |
13.00 |
| population level trace |
|---|
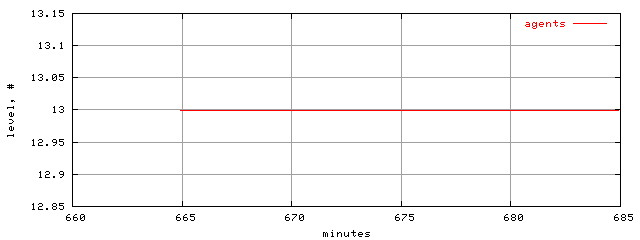 |
Populus is a set of all live robot or server agents. While alive, an agent may participate in HTTP transactions or remain idle.
| Stream |
Contribution |
Rates |
Totals |
|---|
Count
(%) |
Volume
(%) |
Count
(xact/sec) |
Volume
(Mbits/sec) |
Count
(xact,M) |
Volume
(Gbyte) |
|---|
| "foreign" |
0.00 |
0.00 |
0.00 |
0.00 |
0.00 |
0.00 |
|---|
| "image" |
62.11 |
41.16 |
14.38 |
0.55 |
0.02 |
0.08 |
|---|
| "HTML" |
16.21 |
11.77 |
3.76 |
0.16 |
0.00 |
0.02 |
|---|
| "download" |
0.18 |
11.42 |
0.04 |
0.15 |
0.00 |
0.02 |
|---|
| "applet" |
0.37 |
0.18 |
0.09 |
0.00 |
0.00 |
0.00 |
|---|
| "other" |
7.13 |
24.05 |
1.65 |
0.32 |
0.00 |
0.05 |
|---|
| all content types |
86.00 |
88.59 |
19.92 |
1.19 |
0.02 |
0.17 |
|---|
| hits |
53.78 |
36.90 |
12.46 |
0.49 |
0.01 |
0.07 |
|---|
| misses |
32.22 |
51.69 |
7.46 |
0.69 |
0.01 |
0.10 |
|---|
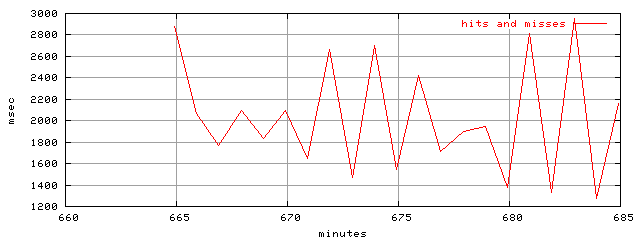
| hits and misses |
86.00 |
88.59 |
19.92 |
1.19 |
0.02 |
0.17 |
|---|
| ims/200 |
4.84 |
5.86 |
1.12 |
0.08 |
0.00 |
0.01 |
|---|
| ims/304 |
3.13 |
0.06 |
0.73 |
0.00 |
0.00 |
0.00 |
|---|
| all ims |
7.97 |
5.92 |
1.85 |
0.08 |
0.00 |
0.01 |
|---|
| cachable |
69.26 |
68.34 |
16.04 |
0.91 |
0.02 |
0.13 |
|---|
| not cachable |
16.75 |
20.25 |
3.88 |
0.27 |
0.00 |
0.04 |
|---|
| cachable and not |
86.00 |
88.59 |
19.92 |
1.19 |
0.02 |
0.17 |
|---|
| fill |
15.47 |
31.44 |
3.58 |
0.42 |
0.00 |
0.06 |
|---|
| reload |
5.64 |
4.82 |
1.31 |
0.06 |
0.00 |
0.01 |
|---|
| abort |
0.03 |
0.03 |
0.01 |
0.00 |
0.00 |
0.00 |
|---|
| redirected request |
0.00 |
0.00 |
0.00 |
0.00 |
0.00 |
0.00 |
|---|
| reply to redirect |
0.00 |
0.00 |
0.00 |
0.00 |
0.00 |
0.00 |
|---|
| HEAD |
0.03 |
0.00 |
0.01 |
0.00 |
0.00 |
0.00 |
|---|
| POST |
0.36 |
0.68 |
0.08 |
0.01 |
0.00 |
0.00 |
|---|
| PUT |
0.00 |
0.00 |
0.00 |
0.00 |
0.00 |
0.00 |
|---|
| all non-gets |
0.38 |
0.68 |
0.09 |
0.01 |
0.00 |
0.00 |
|---|
| all replies |
100.00 |
100.00 |
23.16 |
1.34 |
0.03 |
0.20 |
|---|
The 'Stream' table provides count and volume statistics for many classes of transactions. The 'Contribution' columns show count- and volume-based portions of all transactions. The 'Rates' columns show throughput and bandwidth measurements. The 'Totals' columns contain the total number of transactions and the total volume (a sum of individual response sizes) for each stream.
Note that some streams are a combination of other streams. For example, the 'all ims' stream contains transactions with If-Modified-Since requests that resulted in either '200 OK' (the 'ims/304' stream) or '304 Not Modified' (the 'ims/304' stream) responses.
Many combination streams, such as 'all content types' or 'hits and misses' stream, contribute less than 100% because properties like content type or hit status are distinguished for 'basic' transactions only. A basic transactions is a simple HTTP GET request resulted in a '200 OK' response. Various special transactions such as IMS or aborts do not belong to the 'basic' category.
The 'Object' table contains corresponding response time and size statistics for streams.
| Object |
Response time (msec) |
Size (KBytes) |
|---|
| Min |
Mean |
Max |
Min |
Mean |
Max |
|---|
| "foreign" |
n/a |
n/a |
n/a |
n/a |
n/a |
n/a |
|---|
| "image" |
n/a |
n/a |
n/a |
0.32 |
4.90 |
52.38 |
|---|
| "HTML" |
n/a |
n/a |
n/a |
0.38 |
5.37 |
55.56 |
|---|
| "download" |
n/a |
n/a |
n/a |
18.35 |
469.97 |
1304.16 |
|---|
| "applet" |
n/a |
n/a |
n/a |
0.81 |
3.70 |
9.48 |
|---|
| "other" |
n/a |
n/a |
n/a |
7.74 |
24.95 |
72.65 |
|---|
| all content types |
n/a |
n/a |
n/a |
0.32 |
7.62 |
1304.16 |
|---|
| hits |
3.00 |
1465.57 |
11280.00 |
0.41 |
5.07 |
264.36 |
|---|
| misses |
7.00 |
2615.79 |
15872.00 |
0.32 |
11.87 |
1304.16 |
|---|
| hits and misses |
3.00 |
1896.49 |
15872.00 |
0.32 |
7.62 |
1304.16 |
|---|
| ims/200 |
3.00 |
1896.61 |
8737.00 |
0.32 |
8.95 |
1304.16 |
|---|
| ims/304 |
2.00 |
1710.97 |
6641.00 |
0.09 |
0.14 |
0.16 |
|---|
| all ims |
2.00 |
1823.66 |
8737.00 |
0.09 |
5.49 |
1304.16 |
|---|
| cachable |
3.00 |
1726.94 |
15872.00 |
0.38 |
7.30 |
1304.16 |
|---|
| not cachable |
7.00 |
2597.72 |
6597.00 |
0.32 |
8.94 |
113.09 |
|---|
| cachable and not |
3.00 |
1896.49 |
15872.00 |
0.32 |
7.62 |
1304.16 |
|---|
| fill |
10.00 |
2635.35 |
15872.00 |
0.38 |
15.03 |
1304.16 |
|---|
| reload |
8.00 |
2504.27 |
6053.00 |
0.37 |
6.32 |
113.09 |
|---|
| abort |
5234.00 |
7421.33 |
9187.00 |
0.42 |
6.33 |
17.53 |
|---|
| redirected request |
n/a |
n/a |
n/a |
n/a |
n/a |
n/a |
|---|
| reply to redirect |
n/a |
n/a |
n/a |
n/a |
n/a |
n/a |
|---|
| HEAD |
318.00 |
1996.71 |
4918.00 |
0.32 |
0.37 |
0.41 |
|---|
| POST |
903.00 |
2759.09 |
7301.00 |
0.45 |
13.92 |
308.73 |
|---|
| PUT |
n/a |
n/a |
n/a |
n/a |
n/a |
n/a |
|---|
| all non-gets |
318.00 |
2709.21 |
7301.00 |
0.32 |
13.03 |
308.73 |
|---|
| all replies |
2.00 |
1928.08 |
15872.00 |
0.09 |
7.40 |
1304.16 |
|---|
The 'Object' table provides response time and response size statistics for many classes of transactions.
Note that some classes are a combination of other classes. For example, the 'all ims' class contains transactions with If-Modified-Since requests that resulted in either '200 OK' (the 'ims/304' class) or '304 Not Modified' (the 'ims/304' class) responses.
Some statistics may not be available because either no objects of the corresponding class were seen during the test or no facilities to collect the stats exist for the class. The former can be verified using a 'Stream' table.
The total of 290 errors detected. Out of those errors, 290xact or 1.03% of all transactions were classified as transaction errors.
| Error |
Count |
Contribution (%) |
|---|
| (c17) connection closed before sending headers |
290 |
100.00 |
|---|
The 'Errors' table shows detected errors. For each
error type, the number of errors and their contribution towards
total error count are shown.
No instances of this object class were observed or recorded in the given scope.
This object class represents one of the content types specified in the PGL workload file and labeled there as "foreign".
| contribution: |
62.11% by count and 41.16% by volume |
|---|
| rates: |
14.38xact/sec or 0.55Mbits/sec |
|---|
| totals: |
0.02Mxact and 0.08GByte |
|---|
| response time: |
n/a min, n/a mean, and n/a max |
|---|
| response size: |
0.32KBytes min, 4.90KBytes mean, and 52.38KBytes max |
|---|
No response time and size histograms were collected or stored for this object class.
No response time and size traces are collected for this object class.
This object class represents one of the content types specified in the PGL workload file and labeled there as "image".
| contribution: |
16.21% by count and 11.77% by volume |
|---|
| rates: |
3.76xact/sec or 0.16Mbits/sec |
|---|
| totals: |
0.00Mxact and 0.02GByte |
|---|
| response time: |
n/a min, n/a mean, and n/a max |
|---|
| response size: |
0.38KBytes min, 5.37KBytes mean, and 55.56KBytes max |
|---|
No response time and size histograms were collected or stored for this object class.
No response time and size traces are collected for this object class.
This object class represents one of the content types specified in the PGL workload file and labeled there as "HTML".
| contribution: |
0.18% by count and 11.42% by volume |
|---|
| rates: |
0.04xact/sec or 0.15Mbits/sec |
|---|
| totals: |
0.00Mxact and 0.02GByte |
|---|
| response time: |
n/a min, n/a mean, and n/a max |
|---|
| response size: |
18.35KBytes min, 469.97KBytes mean, and 1304.16KBytes max |
|---|
No response time and size histograms were collected or stored for this object class.
No response time and size traces are collected for this object class.
This object class represents one of the content types specified in the PGL workload file and labeled there as "download".
| contribution: |
0.37% by count and 0.18% by volume |
|---|
| rates: |
0.09xact/sec or 0.00Mbits/sec |
|---|
| totals: |
0.00Mxact and 0.00GByte |
|---|
| response time: |
n/a min, n/a mean, and n/a max |
|---|
| response size: |
0.81KBytes min, 3.70KBytes mean, and 9.48KBytes max |
|---|
No response time and size histograms were collected or stored for this object class.
No response time and size traces are collected for this object class.
This object class represents one of the content types specified in the PGL workload file and labeled there as "applet".
| contribution: |
7.13% by count and 24.05% by volume |
|---|
| rates: |
1.65xact/sec or 0.32Mbits/sec |
|---|
| totals: |
0.00Mxact and 0.05GByte |
|---|
| response time: |
n/a min, n/a mean, and n/a max |
|---|
| response size: |
7.74KBytes min, 24.95KBytes mean, and 72.65KBytes max |
|---|
No response time and size histograms were collected or stored for this object class.
No response time and size traces are collected for this object class.
This object class represents one of the content types specified in the PGL workload file and labeled there as "other".
| contribution: |
86.00% by count and 88.59% by volume |
|---|
| rates: |
19.92xact/sec or 1.19Mbits/sec |
|---|
| totals: |
0.02Mxact and 0.17GByte |
|---|
| response time: |
n/a min, n/a mean, and n/a max |
|---|
| response size: |
0.32KBytes min, 7.62KBytes mean, and 1304.16KBytes max |
|---|
No response time and size histograms were collected or stored for this object class.
No response time and size traces are collected for this object class.
No description is available for this object class.
This object class belongs to the 'all replies' class.
| contribution: |
53.78% by count and 36.90% by volume |
|---|
| rates: |
12.46xact/sec or 0.49Mbits/sec |
|---|
| totals: |
0.01Mxact and 0.07GByte |
|---|
| response time: |
3.00msec min, 1465.57msec mean, and 11280.00msec max |
|---|
| response size: |
0.41KBytes min, 5.07KBytes mean, and 264.36KBytes max |
|---|
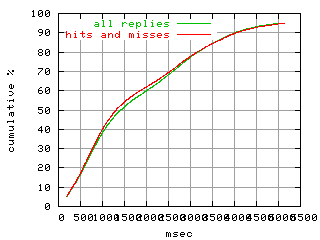
| response time distribution |
|---|
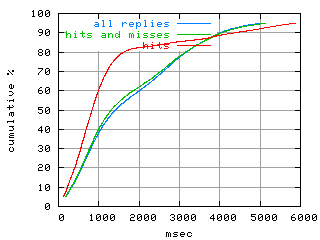 |
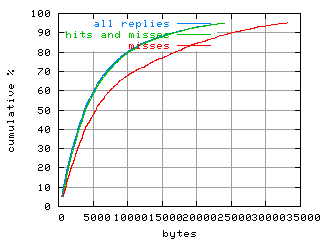
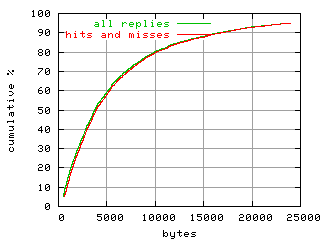
| object size distribution |
|---|
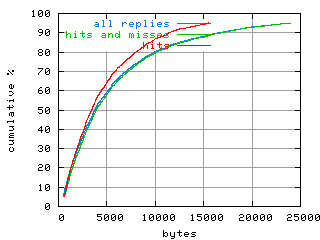 |
| response time trace |
|---|
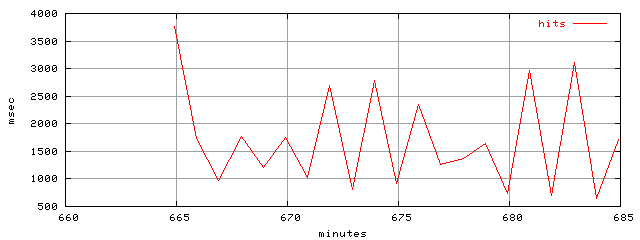 |
No description is available for this object class.
This object class belongs to the 'hits and misses' class.
| contribution: |
32.22% by count and 51.69% by volume |
|---|
| rates: |
7.46xact/sec or 0.69Mbits/sec |
|---|
| totals: |
0.01Mxact and 0.10GByte |
|---|
| response time: |
7.00msec min, 2615.79msec mean, and 15872.00msec max |
|---|
| response size: |
0.32KBytes min, 11.87KBytes mean, and 1304.16KBytes max |
|---|
| response time distribution |
|---|
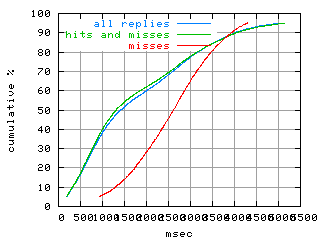 |
| object size distribution |
|---|
 |
| response time trace |
|---|
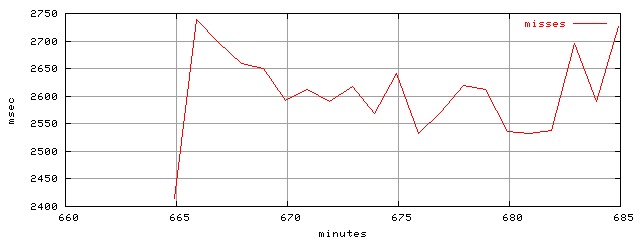 |
No description is available for this object class.
This object class belongs to the 'hits and misses' class.
| contribution: |
86.00% by count and 88.59% by volume |
|---|
| rates: |
19.92xact/sec or 1.19Mbits/sec |
|---|
| totals: |
0.02Mxact and 0.17GByte |
|---|
| response time: |
3.00msec min, 1896.49msec mean, and 15872.00msec max |
|---|
| response size: |
0.32KBytes min, 7.62KBytes mean, and 1304.16KBytes max |
|---|
| response time distribution |
|---|
 |
| object size distribution |
|---|
 |
| response time trace |
|---|
 |
No description is available for this object class.
This object class belongs to the 'all replies' class.
| contribution: |
4.84% by count and 5.86% by volume |
|---|
| rates: |
1.12xact/sec or 0.08Mbits/sec |
|---|
| totals: |
0.00Mxact and 0.01GByte |
|---|
| response time: |
3.00msec min, 1896.61msec mean, and 8737.00msec max |
|---|
| response size: |
0.32KBytes min, 8.95KBytes mean, and 1304.16KBytes max |
|---|
| response time distribution |
|---|
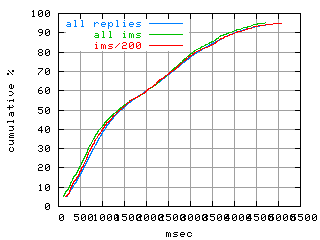 |
| object size distribution |
|---|
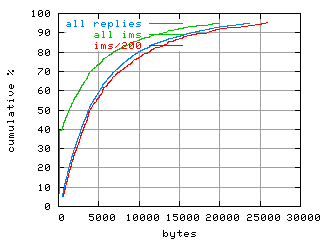 |
No response time and size traces are collected for this object class.
No description is available for this object class.
This object class belongs to the 'all ims' class.
| contribution: |
3.13% by count and 0.06% by volume |
|---|
| rates: |
0.73xact/sec or 0.00Mbits/sec |
|---|
| totals: |
0.00Mxact and 0.00GByte |
|---|
| response time: |
2.00msec min, 1710.97msec mean, and 6641.00msec max |
|---|
| response size: |
0.09KBytes min, 0.14KBytes mean, and 0.16KBytes max |
|---|
| response time distribution |
|---|
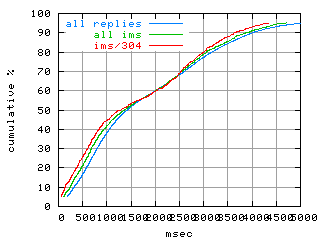 |
| object size distribution |
|---|
 |
No response time and size traces are collected for this object class.
No description is available for this object class.
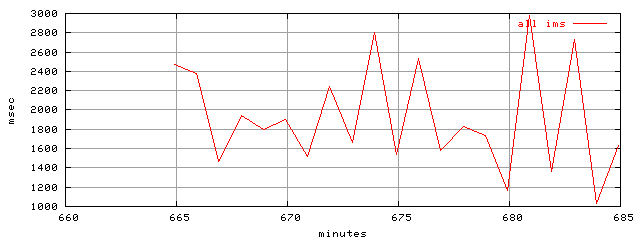
This object class belongs to the 'all ims' class.
| contribution: |
7.97% by count and 5.92% by volume |
|---|
| rates: |
1.85xact/sec or 0.08Mbits/sec |
|---|
| totals: |
0.00Mxact and 0.01GByte |
|---|
| response time: |
2.00msec min, 1823.66msec mean, and 8737.00msec max |
|---|
| response size: |
0.09KBytes min, 5.49KBytes mean, and 1304.16KBytes max |
|---|
| response time distribution |
|---|
 |
| object size distribution |
|---|
 |
| response time trace |
|---|
 |
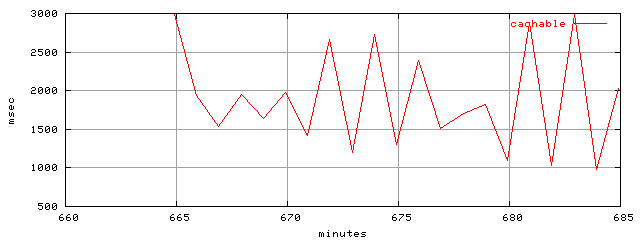
No description is available for this object class.
This object class belongs to the 'all replies' class.
| contribution: |
69.26% by count and 68.34% by volume |
|---|
| rates: |
16.04xact/sec or 0.91Mbits/sec |
|---|
| totals: |
0.02Mxact and 0.13GByte |
|---|
| response time: |
3.00msec min, 1726.94msec mean, and 15872.00msec max |
|---|
| response size: |
0.38KBytes min, 7.30KBytes mean, and 1304.16KBytes max |
|---|
No response time and size histograms were collected or stored for this object class.
| response time trace |
|---|
 |
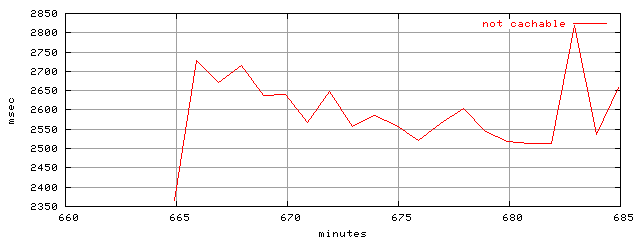
No description is available for this object class.
This object class belongs to the 'cachable and not' class.
| contribution: |
16.75% by count and 20.25% by volume |
|---|
| rates: |
3.88xact/sec or 0.27Mbits/sec |
|---|
| totals: |
0.00Mxact and 0.04GByte |
|---|
| response time: |
7.00msec min, 2597.72msec mean, and 6597.00msec max |
|---|
| response size: |
0.32KBytes min, 8.94KBytes mean, and 113.09KBytes max |
|---|
No response time and size histograms were collected or stored for this object class.
| response time trace |
|---|
 |
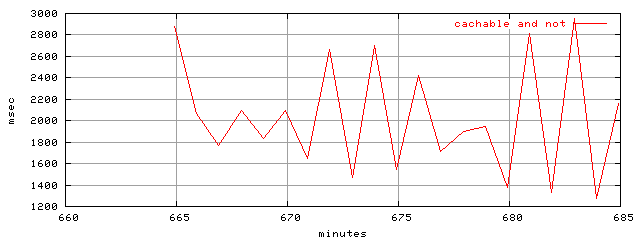
No description is available for this object class.
This object class belongs to the 'cachable and not' class.
| contribution: |
86.00% by count and 88.59% by volume |
|---|
| rates: |
19.92xact/sec or 1.19Mbits/sec |
|---|
| totals: |
0.02Mxact and 0.17GByte |
|---|
| response time: |
3.00msec min, 1896.49msec mean, and 15872.00msec max |
|---|
| response size: |
0.32KBytes min, 7.62KBytes mean, and 1304.16KBytes max |
|---|
No response time and size histograms were collected or stored for this object class.
| response time trace |
|---|
 |
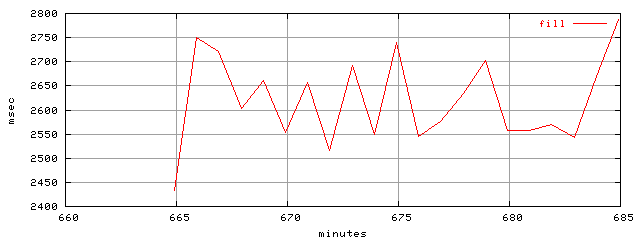
No description is available for this object class.
This object class belongs to the 'all replies' class.
| contribution: |
15.47% by count and 31.44% by volume |
|---|
| rates: |
3.58xact/sec or 0.42Mbits/sec |
|---|
| totals: |
0.00Mxact and 0.06GByte |
|---|
| response time: |
10.00msec min, 2635.35msec mean, and 15872.00msec max |
|---|
| response size: |
0.38KBytes min, 15.03KBytes mean, and 1304.16KBytes max |
|---|
No response time and size histograms were collected or stored for this object class.
| response time trace |
|---|
 |
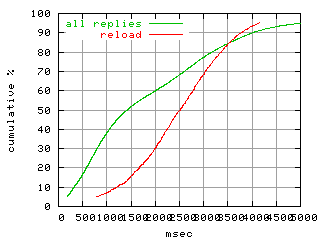
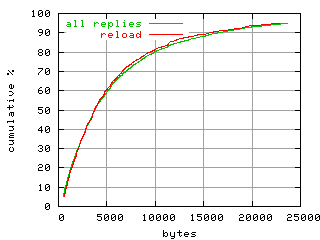
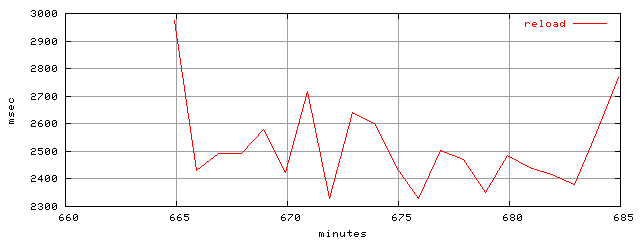
No description is available for this object class.
This object class belongs to the 'all replies' class.
| contribution: |
5.64% by count and 4.82% by volume |
|---|
| rates: |
1.31xact/sec or 0.06Mbits/sec |
|---|
| totals: |
0.00Mxact and 0.01GByte |
|---|
| response time: |
8.00msec min, 2504.27msec mean, and 6053.00msec max |
|---|
| response size: |
0.37KBytes min, 6.32KBytes mean, and 113.09KBytes max |
|---|
| response time distribution |
|---|
 |
| object size distribution |
|---|
 |
| response time trace |
|---|
 |
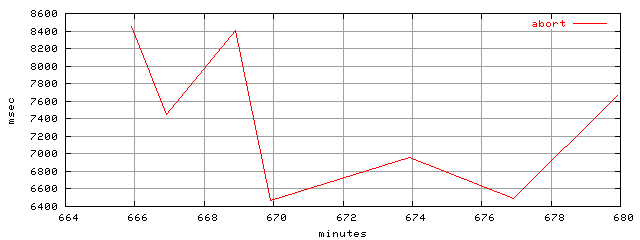
No description is available for this object class.
This object class belongs to the 'all replies' class.
| contribution: |
0.03% by count and 0.03% by volume |
|---|
| rates: |
0.01xact/sec or 0.00Mbits/sec |
|---|
| totals: |
0.00Mxact and 0.00GByte |
|---|
| response time: |
5234.00msec min, 7421.33msec mean, and 9187.00msec max |
|---|
| response size: |
0.42KBytes min, 6.33KBytes mean, and 17.53KBytes max |
|---|
No response time and size histograms were collected or stored for this object class.
| response time trace |
|---|
 |
No description is available for this object class.
This object class belongs to the 'all replies' class.
No instances of this object class were observed or recorded in the given scope.
No description is available for this object class.
This object class belongs to the 'all replies' class.
No instances of this object class were observed or recorded in the given scope.
No description is available for this object class.
This object class belongs to the 'all replies' class.
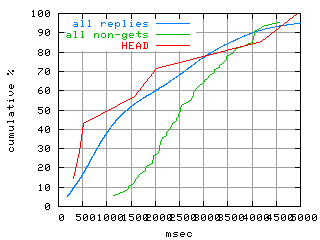
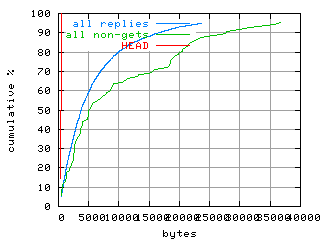
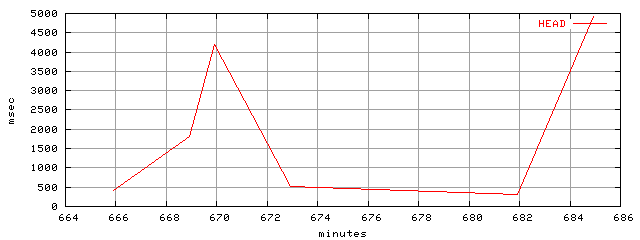
| contribution: |
0.03% by count and 0.00% by volume |
|---|
| rates: |
0.01xact/sec or 0.00Mbits/sec |
|---|
| totals: |
0.00Mxact and 0.00GByte |
|---|
| response time: |
318.00msec min, 1996.71msec mean, and 4918.00msec max |
|---|
| response size: |
0.32KBytes min, 0.37KBytes mean, and 0.41KBytes max |
|---|
| response time distribution |
|---|
 |
| object size distribution |
|---|
 |
| response time trace |
|---|
 |
No description is available for this object class.
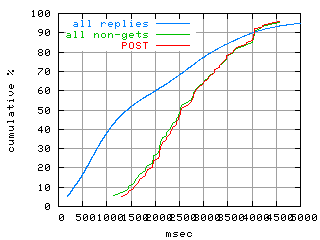
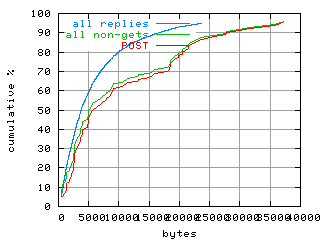
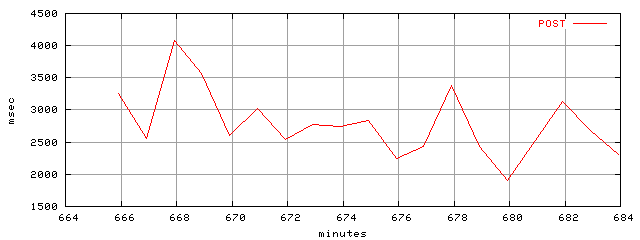
This object class belongs to the 'all non-gets' class.
| contribution: |
0.36% by count and 0.68% by volume |
|---|
| rates: |
0.08xact/sec or 0.01Mbits/sec |
|---|
| totals: |
0.00Mxact and 0.00GByte |
|---|
| response time: |
903.00msec min, 2759.09msec mean, and 7301.00msec max |
|---|
| response size: |
0.45KBytes min, 13.92KBytes mean, and 308.73KBytes max |
|---|
| response time distribution |
|---|
 |
| object size distribution |
|---|
 |
| response time trace |
|---|
 |
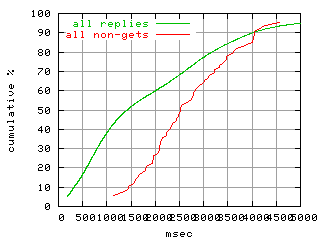
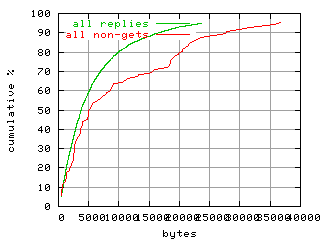
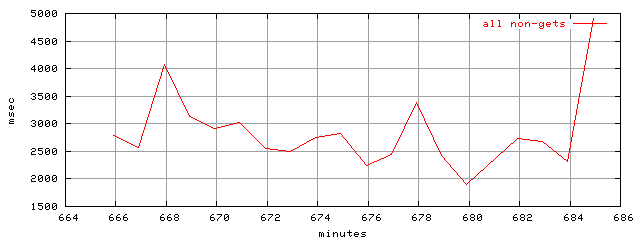
No description is available for this object class.
This object class belongs to the 'all non-gets' class.
No instances of this object class were observed or recorded in the given scope.
No description is available for this object class.
This object class belongs to the 'all non-gets' class.
| contribution: |
0.38% by count and 0.68% by volume |
|---|
| rates: |
0.09xact/sec or 0.01Mbits/sec |
|---|
| totals: |
0.00Mxact and 0.00GByte |
|---|
| response time: |
318.00msec min, 2709.21msec mean, and 7301.00msec max |
|---|
| response size: |
0.32KBytes min, 13.03KBytes mean, and 308.73KBytes max |
|---|
| response time distribution |
|---|
 |
| object size distribution |
|---|
 |
| response time trace |
|---|
 |
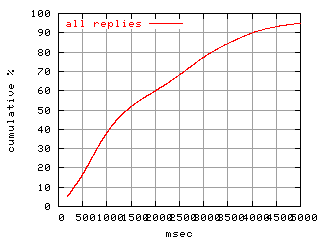
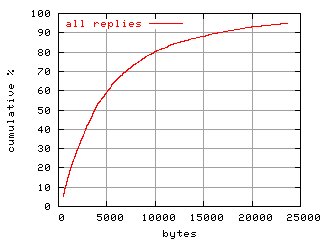
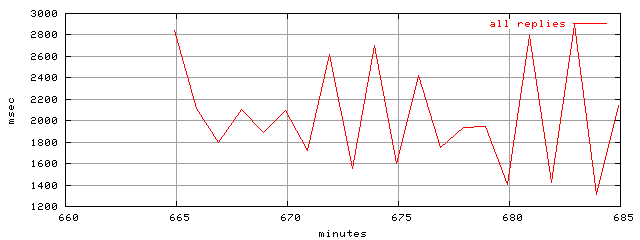
No description is available for this object class.
This object class belongs to the 'all replies' class.
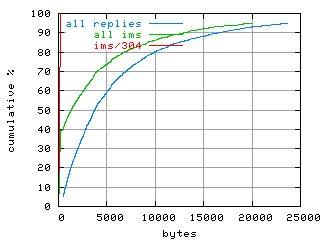
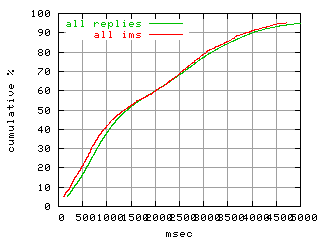
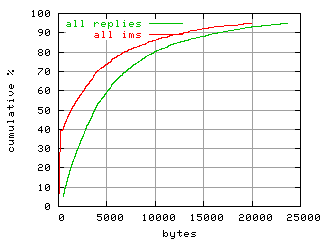
| contribution: |
100.00% by count and 100.00% by volume |
|---|
| rates: |
23.16xact/sec or 1.34Mbits/sec |
|---|
| totals: |
0.03Mxact and 0.20GByte |
|---|
| response time: |
2.00msec min, 1928.08msec mean, and 15872.00msec max |
|---|
| response size: |
0.09KBytes min, 7.40KBytes mean, and 1304.16KBytes max |
|---|
| response time distribution |
|---|
 |
| object size distribution |
|---|
 |
| response time trace |
|---|
 |
No description is available for this object class.